Tracing Python Applications
Choose your platform#
Instance#
Django#
Add
sf-elastic-apm==6.3.4sf-apm-lib==0.1.1entries in requirements.txt file and install these in your project environment
or
Install through CLI using
pip install sf-elastic-apm==6.3.4 pip install sf-apm-lib==0.1.1Provide SF_PROJECT_NAME, SF_APP_NAME, SF_PROFILE_KEY as an environment variable.
Add following entries in settings.py
Add import statement
from sf_apm_lib.snappyflow import SnappyflowAdd following entry in INSTALLED_APPS
'elasticapm.contrib.django'Add following entry in MIDDLEWARE
'elasticapm.contrib.django.middleware.TracingMiddleware'Add this entry for instrumenting Django app
try: sf = Snappyflow() # Initialize Snappyflow. By default intialization will take profileKey, projectName and appName from sfagent config.yaml # Add below part to manually configure the initialization SF_PROJECT_NAME = os.getenv('SF_PROJECT_NAME') SF_APP_NAME = os.getenv('SF_APP_NAME') profile_key = os.getenv('SF_PROFILE_KEY') sf.init(profile_key, SF_PROJECT_NAME, SF_APP_NAME) # End of manual configuration SFTRACE_CONFIG = sf.get_trace_config() ELASTIC_APM={ 'SERVICE_NAME': "<Service name>" , # Specify your service name for tracing 'SERVER_URL': SFTRACE_CONFIG.get('SFTRACE_SERVER_URL'), 'GLOBAL_LABELS': SFTRACE_CONFIG.get('SFTRACE_GLOBAL_LABELS'), 'VERIFY_SERVER_CERT': SFTRACE_CONFIG.get('SFTRACE_VERIFY_SERVER_CERT'), 'SPAN_FRAMES_MIN_DURATION': SFTRACE_CONFIG.get('SFTRACE_SPAN_FRAMES_MIN_DURATION'), 'STACK_TRACE_LIMIT': SFTRACE_CONFIG.get('SFTRACE_STACK_TRACE_LIMIT'), 'CAPTURE_SPAN_STACK_TRACES': SFTRACE_CONFIG.get('SFTRACE_CAPTURE_SPAN_STACK_TRACES'), 'DJANGO_TRANSACTION_NAME_FROM_ROUTE': True, 'CENTRAL_CONFIG': False, 'DEBUG': True } except Exception as error: print("Error while fetching snappyflow tracing configurations", error)
Once your server is up and running you can check trace in Snappyflow Server.
For viewing trace in snappyflow server make sure project and app name is created or discovered with project name and app name specified in point no.2
Once project and app name is created go to View dashboard -> Click on Tracing on lef side bar -> Click on view transaction -> Go to real time tab
For complete code refer sample app refer at:
https://github.com/snappyflow/tracing-reference-apps/tree/master/refapp-django
Flask#
Add
sf-elastic-apm[flask]==6.3.4sf-apm-lib==0.1.1entries in requirements.txt file and install these in your project environment
or
Install through CLI using
pip install sf-elastic-apm[flask]==6.3.4 pip install sf-apm-lib==0.1.1Provide SF_PROJECT_NAME, SF_APP_NAME, SF_PROFILE_KEY as an environment variable.
Add following entries in app.py
Add imports statement
from elasticapm.contrib.flask import ElasticAPM from sf_apm_lib.snappyflow import SnappyflowGet trace config
sf = Snappyflow() # Initialize Snappyflow. By default intialization will take profileKey, projectName and appName from sfagent config.yaml # Add below part to manually configure the initialization SF_PROJECT_NAME = os.getenv('SF_PROJECT_NAME') SF_APP_NAME = os.getenv('SF_APP_NAME') profile_key = os.getenv('SF_PROFILE_KEY') sf.init(profile_key, SF_PROJECT_NAME, SF_APP_NAME) # End of manual configuration SFTRACE_CONFIG = sf.get_trace_config()Initialize elastic apm and instrument it to flask app
app.config['ELASTIC_APM'] = { 'SERVICE_NAME': '<SERVICE_NAME>', # Specify your service name for tracing 'SERVER_URL': SFTRACE_CONFIG.get('SFTRACE_SERVER_URL'), 'GLOBAL_LABELS': SFTRACE_CONFIG.get('SFTRACE_GLOBAL_LABELS'), 'VERIFY_SERVER_CERT': SFTRACE_CONFIG.get('SFTRACE_VERIFY_SERVER_CERT'), 'SPAN_FRAMES_MIN_DURATION': SFTRACE_CONFIG.get('SFTRACE_SPAN_FRAMES_MIN_DURATION'), 'STACK_TRACE_LIMIT': SFTRACE_CONFIG.get('SFTRACE_STACK_TRACE_LIMIT'), 'CAPTURE_SPAN_STACK_TRACES': SFTRACE_CONFIG.get('SFTRACE_CAPTURE_SPAN_STACK_TRACES'), 'DEBUG': True } apm = ElasticAPM(app)Once your server is up and running you can check trace in Snappyflow Server.
For viewing trace in snappyflow server make sure project and app name is created or discovered with project name and app name specified in point no.2
Once project and app name is created, Go to View dashboard -> Click on Tracing on lef side bar -> Click on view transaction -> Go to real time tab
Script#
Install following requirements
pip install sf-elastic-apm==6.3.4 pip install sf-apm-lib==0.1.1Add following code at start of script file to setup elastic apm client
import elasticapm from sf_apm_lib.snappyflow import Snappyflow sf = Snappyflow() # Initialize Snappyflow. By default intialization will pick profileKey, projectName and appName from sfagent config.yaml. # Add below part to manually configure the initialization SF_PROJECT_NAME = '<Snappyflow Project Name>' SF_APP_NAME = '<Snappyflow App Name>' profile_key = '<Snappyflow Profile Key>' sf.init(profile_key, SF_PROJECT_NAME, SF_APP_NAME) # End of manual configuration trace_config = sf.get_trace_config() # Returns trace config client = elasticapm.Client( service_name="<Service name> ",# Specify service name for tracing server_url=trace_config['SFTRACE_SERVER_URL'], verify_cert=trace_config['SFTRACE_VERIFY_SERVER_CERT'], global_labels=trace_config['SFTRACE_GLOBAL_LABELS'] ) elasticapm.instrument() # Only call this once, as early as possible.Once instrumentation is completed we can create custom transaction and span
Example
def main(): sess = requests.Session() for url in [ 'https://www.elastic.co', 'https://benchmarks.elastic.co' ]: resp = sess.get(url) time.sleep(1) client.begin_transaction(transaction_type="script") main() # Record an exception try: 1/0 except ZeroDivisionError: ident = client.capture_exception() print ("Exception caught; reference is %s" % ident) client.end_transaction(name=__name__, result="success")Refer link to know more:
https://www.elastic.co/guide/en/apm/agent/python/master/instrumenting-custom-code.html
Now run you script and test your trace in snappyflow server.
For viewing trace in snappyflow server make sure project and app name is created or discovered with project name and app name specified in point no.2
Once project and app name is created, Go to View dashboard -> Click on Tracing on left side bar -> Click on view transaction -> Go to real time tab
Refer complete script:
Celery#
Install following requirements (Following example is based on redis broker)
pip install sf-elastic-apm==6.3.4 pip install redis pip install sf-apm-lib==0.1.1Add following code at start of the file where celery app is initialized to setup elastic apm client
from sf_apm_lib.snappyflow import Snappyflow from elasticapm import Client, instrument from elasticapm.contrib.celery import register_exception_tracking, register_instrumentation instrument() try: sf = Snappyflow() # Initialize Snappyflow. By default intialization will take profileKey, projectName and appName from sfagent config.yaml # Add below part to manually configure the initialization SF_PROJECT_NAME = '<SF_PROJECT_NAME>' # Replace with appropriate Snappyflow project name SF_APP_NAME = '<SF_APP_NAME>' # Replace with appropriate Snappyflow app name profile_key = '<SF_PROFILE_KEY>' # Replace Snappyflow Profile key sf.init(profile_key, SF_PROJECT_NAME, SF_APP_NAME) # End of manual configuration SFTRACE_CONFIG = sf.get_trace_config() apm_client = Client( service_name= '<Service_Name>', # Specify service name for tracing server_url= SFTRACE_CONFIG.get('SFTRACE_SERVER_URL'), global_labels= SFTRACE_CONFIG.get('SFTRACE_GLOBAL_LABELS'), verify_server_cert= SFTRACE_CONFIG.get('SFTRACE_VERIFY_SERVER_CERT') ) register_exception_tracking(apm_client) register_instrumentation(apm_client) except Exception as error: print("Error while fetching snappyflow tracing configurations", error)Once instrumentation is done and celery worker is running we can see trace for each celery task in Snappyflow server.
For viewing trace in snappyflow server make sure project and app name is created or discovered with project name and app name specified in point no.2
Once project and app name is created, Go to View dashboard -> Click on Tracing on left side bar -> Click on view transaction -> Go to real time tab
Refer complete code:
https://github.com/snappyflow/tracing-reference-apps/blob/master/ref-celery/tasks.py
Kubernetes#
Django#
Add
sf-elastic-apm==6.3.4sf-apm-lib==0.1.1entries in requirements.txt file and install these in your project environment
or
Install through CLI using
pip install sf-elastic-apm==6.3.4 pip install sf-apm-lib==0.1.1Add following entries in settings.py
Add import statement
from sf_apm_lib.snappyflow import SnappyflowAdd following entry in INSTALLED_APPS
'elasticapm.contrib.django'Add following entry in MIDDLEWARE
'elasticapm.contrib.django.middleware.TracingMiddleware'Add this entry for instrumenting Django app
try: sf = Snappyflow() # Initialize Snappyflow. By default intialization will take profileKey, projectName and appName from sfagent config.yaml # Add below part to manually configure the initialization SF_PROJECT_NAME = os.getenv('SF_PROJECT_NAME') SF_APP_NAME = os.getenv('SF_APP_NAME') profile_key = os.getenv('SF_PROFILE_KEY') sf.init(profile_key, SF_PROJECT_NAME, SF_APP_NAME) # End of manual configuration SFTRACE_CONFIG = sf.get_trace_config() ELASTIC_APM={ 'SERVICE_NAME': "<Service name>" , # Specify your service name for tracing 'SERVER_URL': SFTRACE_CONFIG.get('SFTRACE_SERVER_URL'), 'GLOBAL_LABELS': SFTRACE_CONFIG.get('SFTRACE_GLOBAL_LABELS'), 'VERIFY_SERVER_CERT': SFTRACE_CONFIG.get('SFTRACE_VERIFY_SERVER_CERT'), 'SPAN_FRAMES_MIN_DURATION': SFTRACE_CONFIG.get('SFTRACE_SPAN_FRAMES_MIN_DURATION'), 'STACK_TRACE_LIMIT': SFTRACE_CONFIG.get('SFTRACE_STACK_TRACE_LIMIT'), 'CAPTURE_SPAN_STACK_TRACES': SFTRACE_CONFIG.get('SFTRACE_CAPTURE_SPAN_STACK_TRACES'), 'DJANGO_TRANSACTION_NAME_FROM_ROUTE': True, 'CENTRAL_CONFIG': False, 'DEBUG': True } except Exception as error: print("Error while fetching snappyflow tracing configurations", error)
Provide SF_PROJECT_NAME, SF_APP_NAME, SF_PROFILE_KEY as an environment variables in Kubernetes deployment file.
https://kubernetes.io/docs/tasks/inject-data-application/define-environment-variable-container/
If deploying with helm provide above variables in values.yaml and use them in deployment file of charts.
https://phoenixnap.com/kb/helm-environment-variables
Once your server is up and running you can check trace in Snappyflow Server.
For viewing trace in snappyflow server make sure project and app name is created or discovered with project name and app name specified in point no.2
Once project and app name is created go to View dashboard -> Click on Tracing on lef side bar -> Click on view transaction -> Go to real time tab
For complete code refer sample app refer at:
https://github.com/snappyflow/tracing-reference-apps/tree/master/refapp-django
Flask#
Add
sf-elastic-apm[flask]==6.3.4sf-apm-lib==0.1.1entries in requirements.txt file and install these in your project environment
or
Install through CLI using
RUN pip install sf-elastic-apm[flask]==6.3.4 RUN pip install sf-apm-lib==0.1.1Add following entries in app.py
Add imports statement
from elasticapm.contrib.flask import ElasticAPM from sf_apm_lib.snappyflow import SnappyflowGet trace config
sf = Snappyflow() # Initialize Snappyflow. By default intialization will take profileKey, projectName and appName from sfagent config.yaml # Add below part to manually configure the initialization SF_PROJECT_NAME = os.getenv('SF_PROJECT_NAME') SF_APP_NAME = os.getenv('SF_APP_NAME') profile_key = os.getenv('SF_PROFILE_KEY') sf.init(profile_key, SF_PROJECT_NAME, SF_APP_NAME) # End of manual configuration SFTRACE_CONFIG = sf.get_trace_config()Initialize elastic apm and instrument it to flask app
app.config['ELASTIC_APM'] = { 'SERVICE_NAME': '<SERVICE_NAME>', # Specify your service name for tracing 'SERVER_URL': SFTRACE_CONFIG.get('SFTRACE_SERVER_URL'), 'GLOBAL_LABELS': SFTRACE_CONFIG.get('SFTRACE_GLOBAL_LABELS'), 'VERIFY_SERVER_CERT': SFTRACE_CONFIG.get('SFTRACE_VERIFY_SERVER_CERT'), 'SPAN_FRAMES_MIN_DURATION': SFTRACE_CONFIG.get('SFTRACE_SPAN_FRAMES_MIN_DURATION'), 'STACK_TRACE_LIMIT': SFTRACE_CONFIG.get('SFTRACE_STACK_TRACE_LIMIT'), 'CAPTURE_SPAN_STACK_TRACES': SFTRACE_CONFIG.get('SFTRACE_CAPTURE_SPAN_STACK_TRACES'), 'DEBUG': True } apm = ElasticAPM(app)
Provide SF_PROJECT_NAME, SF_APP_NAME, SF_PROFILE_KEY as an environment variables in Kubernetes deployment file.
https://kubernetes.io/docs/tasks/inject-data-application/define-environment-variable-container/
If deploying with helm provide above variables in values.yaml and use them in deployment file of charts.
Once your server is up and running you can check trace in Snappyflow Server.
For viewing trace in snappyflow server make sure project and app name is created or discovered with project name and app name specified in point no.2
Once project and app name is created, Go to View dashboard -> Click on Tracing on lef side bar -> Click on view transaction -> Go to real time tab
Celery#
Install following requirements (Following example is based on redis broker)
pip install sf-elastic-apm==6.3.4 pip install redis pip install sf-apm-lib==0.1.1Add following code at start of the file where celery app is initialized to setup elastic apm client
from sf_apm_lib.snappyflow import Snappyflow from elasticapm import Client, instrument from elasticapm.contrib.celery import register_exception_tracking, register_instrumentation instrument() try: sf = Snappyflow() # Initialize Snappyflow. By default intialization will take profileKey, projectName and appName from sfagent config.yaml # Add below part to manually configure the initialization SF_PROJECT_NAME = '<SF_PROJECT_NAME>' # Replace with appropriate Snappyflow project name SF_APP_NAME = '<SF_APP_NAME>' # Replace with appropriate Snappyflow app name profile_key = '<SF_PROFILE_KEY>' # Replace Snappyflow Profile key sf.init(profile_key, SF_PROJECT_NAME, SF_APP_NAME) # End of manual configuration SFTRACE_CONFIG = sf.get_trace_config() apm_client = Client(service_name= '<Service_Name>', # Specify service name for tracing server_url= SFTRACE_CONFIG.get('SFTRACE_SERVER_URL'), global_labels= SFTRACE_CONFIG.get('SFTRACE_GLOBAL_LABELS'), verify_server_cert= SFTRACE_CONFIG.get('SFTRACE_VERIFY_SERVER_CERT') ) register_exception_tracking(apm_client) register_instrumentation(apm_client) except Exception as error: print("Error while fetching snappyflow tracing configurations", error)Once instrumentation is done and celery worker is running we can see trace for each celery task in Snappyflow server.
For viewing trace in snappyflow server make sure project and app name is created or discovered with project name and app name specified in point no.2
Once project and app name is created, Go to View dashboard -> Click on Tracing on left side bar -> Click on view transaction -> Go to real time tab
Refer complete code:
https://github.com/snappyflow/tracing-reference-apps/blob/master/ref-celery/tasks.py
Docker#
Django#
Add
sf-elastic-apm==6.3.4sf-apm-lib==0.1.1entries in requirements.txt file and install these in your project environment
or
Install through CLI using
RUN pip install sf-elastic-apm==6.3.4 RUN pip install sf-apm-lib==0.1.1Add following entries in settings.py
Add import statement
from sf_apm_lib.snappyflow import SnappyflowAdd following entry in INSTALLED_APPS
'elasticapm.contrib.django'Add following entry in MIDDLEWARE
'elasticapm.contrib.django.middleware.TracingMiddleware'Add this entry for instrumenting Django app
try:    sf = Snappyflow() # Initialize Snappyflow. By default intialization will take profileKey, projectName and appName from sfagent config.yaml
   # Add below part to manually configure the initialization    SF_PROJECT_NAME = os.getenv('SF_PROJECT_NAME')    SF_APP_NAME = os.getenv('SF_APP_NAME')    profile_key = os.getenv('SF_PROFILE_KEY')    sf.init(profile_key, SF_PROJECT_NAME, SF_APP_NAME)    # End of manual configuration       SFTRACE_CONFIG = sf.get_trace_config()    ELASTIC_APM={       'SERVICE_NAME': "<Service name>" , # Specify your service name for tracing       'SERVER_URL': SFTRACE_CONFIG.get('SFTRACE_SERVER_URL'),       'GLOBAL_LABELS': SFTRACE_CONFIG.get('SFTRACE_GLOBAL_LABELS'),       'VERIFY_SERVER_CERT': SFTRACE_CONFIG.get('SFTRACE_VERIFY_SERVER_CERT'),       'SPAN_FRAMES_MIN_DURATION': SFTRACE_CONFIG.get('SFTRACE_SPAN_FRAMES_MIN_DURATION'),       'STACK_TRACE_LIMIT': SFTRACE_CONFIG.get('SFTRACE_STACK_TRACE_LIMIT'),       'CAPTURE_SPAN_STACK_TRACES': SFTRACE_CONFIG.get('SFTRACE_CAPTURE_SPAN_STACK_TRACES'),       'DJANGO_TRANSACTION_NAME_FROM_ROUTE': True,       'CENTRAL_CONFIG': False,       'DEBUG': True    } except Exception as error:    print("Error while fetching snappyflow tracing configurations", error)
Provide SF_PROJECT_NAME, SF_APP_NAME, SF_PROFILE_KEY as an environment variables in docker-compose.yml or docker stack deployment file or at command line when using docker run command for deployment.
Eg:
Docker-compose and stack: https://docs.docker.com/compose/environment-variables/
Docker RUN:
docker run -d -t -i -e SF_PROJECT_NAME='' \ -e SF_APP_NAME='' \ -e SF_PROFILE_KEY='' \ -p 80:80 \ --link redis:redis \ --name <container_name> <dockerhub_id/image_name>Once your server is up and running you can check trace in Snappyflow Server. For viewing trace in snappyflow server make sure project and app name is created or discovered with project name and app name specified in point no.2
Once project and app name is created go to View dashboard -> Click on Tracing on lef side bar -> Click on view transaction -> Go to real time tab
For complete code refer sample app refer at:
https://github.com/snappyflow/tracing-reference-apps/tree/master/refapp-django
Flask#
Add
sf-elastic-apm[flask]==6.3.4sf-apm-lib==0.1.1entries in requirements.txt file and install these in your project environment
or
Install through CLI using
RUN pip install sf-elastic-apm[flask]==6.3.4 RUN pip install sf-apm-lib==0.1.1Add following entries in app.py
Add imports statement
from elasticapm.contrib.flask import ElasticAPM from sf_apm_lib.snappyflow import SnappyflowGet trace config
sf = Snappyflow() # Initialize Snappyflow. By default intialization will take profileKey, projectName and appName from sfagent config.yaml # Add below part to manually configure the initialization SF_PROJECT_NAME = os.getenv('SF_PROJECT_NAME') SF_APP_NAME = os.getenv('SF_APP_NAME') profile_key = os.getenv('SF_PROFILE_KEY') sf.init(profile_key, SF_PROJECT_NAME, SF_APP_NAME) # End of manual configuration SFTRACE_CONFIG = sf.get_trace_config()Initialize elastic apm and instrument it to flask app
app.config['ELASTIC_APM'] = { 'SERVICE_NAME': '<SERVICE_NAME>', # Specify your service name for tracing 'SERVER_URL': SFTRACE_CONFIG.get('SFTRACE_SERVER_URL'), 'GLOBAL_LABELS': SFTRACE_CONFIG.get('SFTRACE_GLOBAL_LABELS'), 'VERIFY_SERVER_CERT': SFTRACE_CONFIG.get('SFTRACE_VERIFY_SERVER_CERT'), 'SPAN_FRAMES_MIN_DURATION': SFTRACE_CONFIG.get('SFTRACE_SPAN_FRAMES_MIN_DURATION'), 'STACK_TRACE_LIMIT': SFTRACE_CONFIG.get('SFTRACE_STACK_TRACE_LIMIT'), 'CAPTURE_SPAN_STACK_TRACES': SFTRACE_CONFIG.get('SFTRACE_CAPTURE_SPAN_STACK_TRACES'), 'DEBUG': True } apm = ElasticAPM(app)
Provide SF_PROJECT_NAME, SF_APP_NAME, SF_PROFILE_KEY as an environment variables in docker-compose.yml or docker stack deployment file or at command line when using docker run command for deployment.
Eg:
Docker-compose and stack: https://docs.docker.com/compose/environment-variables/
Docker run cli command:
docker run -d -t -i -e SF_PROJECT_NAME='<SF_PROJECT_NAME>' \ -e SF_APP_NAME='<SF_APP_NAME>' \ -e SF_PROFILE_KEY='<snappyflow profile key>' \ --name <container_name> <dockerhub_id/image_name>Once your server is up and running you can check trace in Snappyflow Server.
For viewing trace in snappyflow server make sure project and app name is created or discovered with project name and app name specified in point no.2
Once project and app name is created, Go to View dashboard -> Click on Tracing on lef side bar -> Click on view transaction -> Go to real time tab
Celery#
Install following requirements (Following example is based on redis broker)
pip install sf-elastic-apm==6.3.4 pip install redis pip install sf-apm-lib==0.1.1Add following code at start of the file where celery app is initialized to setup elastic apm client
from sf_apm_lib.snappyflow import Snappyflow from elasticapm import Client, instrument from elasticapm.contrib.celery import register_exception_tracking, register_instrumentation instrument() try: sf = Snappyflow() # Initialize Snappyflow. By default intialization will take profileKey, projectName and appName from sfagent config.yaml # Add below part to manually configure the initialization SF_PROJECT_NAME = '<SF_PROJECT_NAME>' # Replace with appropriate Snappyflow project name SF_APP_NAME = '<SF_APP_NAME>' # Replace with appropriate Snappyflow app name profile_key = '<SF_PROFILE_KEY>' # Replace Snappyflow Profile key sf.init(profile_key, SF_PROJECT_NAME, SF_APP_NAME) # End of manual configuration SFTRACE_CONFIG = sf.get_trace_config() apm_client = Client( service_name= '<Service_Name>', # Specify service name for tracing server_url= SFTRACE_CONFIG.get('SFTRACE_SERVER_URL'), global_labels= SFTRACE_CONFIG.get('SFTRACE_GLOBAL_LABELS'), verify_server_cert= SFTRACE_CONFIG.get('SFTRACE_VERIFY_SERVER_CERT') ) register_exception_tracking(apm_client) register_instrumentation(apm_client) except Exception as error: print("Error while fetching snappyflow tracing configurations", error)Once instrumentation is done and celery worker is running we can see trace for each celery task in Snappyflow server.
For viewing trace in snappyflow server make sure project and app name is created or discovered with project name and app name specified in point no.2
Once project and app name is created, Go to View dashboard -> Click on Tracing on left side bar -> Click on view transaction -> Go to real time tab
Refer complete code:
https://github.com/snappyflow/tracing-reference-apps/blob/master/ref-celery/tasks.py
ECS#
Django#
Add
sf-elastic-apm==6.3.4sf-apm-lib==0.1.1entries in requirements.txt file and install these in your project environment
or
Install through CLI using
pip install sf-elastic-apm==6.3.4 pip install sf-apm-lib==0.1.1Add following entries in settings.py
Add import statement
from sf_apm_lib.snappyflow import SnappyflowAdd following entry in INSTALLED_APPS
'elasticapm.contrib.django'Add following entry in MIDDLEWARE:
'elasticapm.contrib.django.middleware.TracingMiddleware'Add this entry for instrumenting Django app
try:    sf = Snappyflow() # Initialize Snappyflow. By default intialization will take profileKey, projectName and appName from sfagent config.yaml      # Add below part to manually configure the initialization    SF_PROJECT_NAME = os.getenv('SF_PROJECT_NAME')    SF_APP_NAME = os.getenv('SF_APP_NAME')    profile_key = os.getenv('SF_PROFILE_KEY')    sf.init(profile_key, SF_PROJECT_NAME, SF_APP_NAME)    # End of manual configuration
   SFTRACE_CONFIG = sf.get_trace_config()    ELASTIC_APM={       'SERVICE_NAME': "<Service name>" , # Specify your service name for tracing       'SERVER_URL': SFTRACE_CONFIG.get('SFTRACE_SERVER_URL'),       'GLOBAL_LABELS': SFTRACE_CONFIG.get('SFTRACE_GLOBAL_LABELS'),       'VERIFY_SERVER_CERT': SFTRACE_CONFIG.get('SFTRACE_VERIFY_SERVER_CERT'),       'SPAN_FRAMES_MIN_DURATION': SFTRACE_CONFIG.get('SFTRACE_SPAN_FRAMES_MIN_DURATION'),       'STACK_TRACE_LIMIT': SFTRACE_CONFIG.get('SFTRACE_STACK_TRACE_LIMIT'),       'CAPTURE_SPAN_STACK_TRACES': SFTRACE_CONFIG.get('SFTRACE_CAPTURE_SPAN_STACK_TRACES'),       'DJANGO_TRANSACTION_NAME_FROM_ROUTE': True,       'CENTRAL_CONFIG': False,       'DEBUG': True    } except Exception as error:    print("Error while fetching snappyflow tracing configurations", error)
Provide SF_PROJECT_NAME, SF_APP_NAME, SF_PROFILE_KEY as an environment variables in add container section of task definitions.
https://docs.aws.amazon.com/AmazonECS/latest/developerguide/taskdef-envfiles.html
Once your server is up and running you can check trace in Snappyflow Server.
For viewing trace in snappyflow server make sure project and app name is created or discovered with project name and app name specified in point no.2
Once project and app name is created go to View dashboard -> Click on Tracing on lef side bar -> Click on view transaction -> Go to real time tab
For complete code refer sample app refer at:
https://github.com/snappyflow/tracing-reference-apps/tree/master/refapp-django
Flask#
Add
sf-elastic-apm[flask]==6.3.4sf-apm-lib==0.1.1entries in requirements.txt file and install these in your project environment
or
Install through CLI using
RUN pip install sf-elastic-apm[flask]==6.3.4 RUN pip install sf-apm-lib==0.1.1Add following entries in app.py
Add imports statement
from elasticapm.contrib.flask import ElasticAPM from sf_apm_lib.snappyflow import SnappyflowGet trace config
sf = Snappyflow() # Initialize Snappyflow. By default intialization will take profileKey, projectName and appName from sfagent config.yaml # Add below part to manually configure the initialization SF_PROJECT_NAME = os.getenv('SF_PROJECT_NAME') SF_APP_NAME = os.getenv('SF_APP_NAME') profile_key = os.getenv('SF_PROFILE_KEY') sf.init(profile_key, SF_PROJECT_NAME, SF_APP_NAME) # End of manual configuration SFTRACE_CONFIG = sf.get_trace_config()Initialize elastic apm and instrument it to flask app
app.config['ELASTIC_APM'] = { 'SERVICE_NAME': '<SERVICE_NAME>', # Specify your service name for tracing 'SERVER_URL': SFTRACE_CONFIG.get('SFTRACE_SERVER_URL'), 'GLOBAL_LABELS': SFTRACE_CONFIG.get('SFTRACE_GLOBAL_LABELS'), 'VERIFY_SERVER_CERT': SFTRACE_CONFIG.get('SFTRACE_VERIFY_SERVER_CERT'), 'SPAN_FRAMES_MIN_DURATION': SFTRACE_CONFIG.get('SFTRACE_SPAN_FRAMES_MIN_DURATION'), 'STACK_TRACE_LIMIT': SFTRACE_CONFIG.get('SFTRACE_STACK_TRACE_LIMIT'), 'CAPTURE_SPAN_STACK_TRACES': SFTRACE_CONFIG.get('SFTRACE_CAPTURE_SPAN_STACK_TRACES'), 'DEBUG': True } apm = ElasticAPM(app)
Provide SF_PROJECT_NAME, SF_APP_NAME, SF_PROFILE_KEY as an environment variables in add container section of task definitions.
https://docs.aws.amazon.com/AmazonECS/latest/developerguide/taskdef-envfiles.html
Once your server is up and running you can check trace in Snappyflow Server.
For viewing trace in snappyflow server make sure project and app name is created or discovered with project name and app name specified in point no.2
Once project and app name is created, Go to View dashboard -> Click on Tracing on lef side bar -> Click on view transaction -> Go to real time tab
Celery#
Install following requirements (Following example is based on redis broker)
pip install sf-elastic-apm==6.3.4 pip install redis pip install sf-apm-lib==0.1.1Add following code at start of the file where celery app is initialized to setup elastic apm client
from sf_apm_lib.snappyflow import Snappyflow from elasticapm import Client, instrument from elasticapm.contrib.celery import register_exception_tracking, register_instrumentation instrument() try: sf = Snappyflow() # Initialize Snappyflow. By default intialization will take profileKey, projectName and appName from sfagent config.yaml # Add below part to manually configure the initialization SF_PROJECT_NAME = '<SF_PROJECT_NAME>' # Replace with appropriate Snappyflow project name SF_APP_NAME = '<SF_APP_NAME>' # Replace with appropriate Snappyflow app name profile_key = '<SF_PROFILE_KEY>' # Replace Snappyflow Profile key sf.init(profile_key, SF_PROJECT_NAME, SF_APP_NAME) # End of manual configuration SFTRACE_CONFIG = sf.get_trace_config() apm_client = Client( service_name= '<Service_Name>', # Specify service name for tracing server_url= SFTRACE_CONFIG.get('SFTRACE_SERVER_URL'), global_labels= SFTRACE_CONFIG.get('SFTRACE_GLOBAL_LABELS'), verify_server_cert= SFTRACE_CONFIG.get('SFTRACE_VERIFY_SERVER_CERT') ) register_exception_tracking(apm_client) register_instrumentation(apm_client) except Exception as error: print("Error while fetching snappyflow tracing configurations", error)Once instrumentation is done and celery worker is running we can see trace for each celery task in Snappyflow server.
For viewing trace in snappyflow server make sure project and app name is created or discovered with project name and app name specified in point no.2
Once project and app name is created, Go to View dashboard -> Click on Tracing on left side bar -> Click on view transaction -> Go to real time tab
Refer complete code:
https://github.com/snappyflow/tracing-reference-apps/blob/master/ref-celery/tasks.py
AWS Lambda#
Script#
Add these python libraries in requirements.txt file. Follow the AWS lambda doc on adding runtime dependency to lambda function.
sf-apm-lib==0.1.1 sf-elastic-apm==6.3.4Instrument lambda function to enable tracing.
Import Libraries
import elasticapm from sf_apm_lib.snappyflow import SnappyflowAdd code to get SnappyFlow Trace config, outside lambda handler method.
sf = Snappyflow()SF_PROJECT_NAME = os.environ['SF_PROJECT_NAME'] SF_APP_NAME = os.environ['SF_APP_NAME'] profile_key = os.environ['SF_PROFILE_KEY'] sf.init(profile_key, SF_PROJECT_NAME, SF_APP_NAME) trace_config = snappyflow.get_trace_config()Add custom instrumentation in lambda handler function
def lambda_handler(event, context): client = elasticapm.Client(service_name="<SERVICE_NAME_CHANGEME>", server_url=trace_config['SFTRACE_SERVER_URL'], verify_cert=trace_config['SFTRACE_VERIFY_SERVER_CERT'], global_labels=trace_config['SFTRACE_GLOBAL_LABELS'] ) elasticapm.instrument() client.begin_transaction(transaction_type="script") # DO SOME WORK. No return statements. client.end_transaction(name=__name__, result="success") # RETURN STATEMENT e.g. return response
Deploy the Lambda function. Follow README to test sample app
Sample code for reference:
https://github.com/upendrasahu/aws-lambda-python-tracing-sample
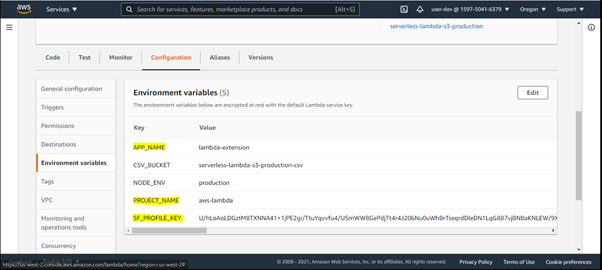
Configure Lambda function before trigger/invoke.
- Add the environment variable SF_PROFILE_KEY and set the value to your profile key copied from SnappyFlow.
- Add environment variables SF_APP_NAME and SF_PROJECT_NAME with appropriate values.